
With AuthoredUp’s Personal Dashboard, you can easily monitor and analyze your content creation strategies to drive growth. In this video, we’ll show you how to:
- Track your posting consistency and progress toward your goals.
- Identify your most influential posts to understand what your audience wants.
- Collect and analyze data about your connections and followers.
The AuthoredUp Dashboard is designed to offer valuable insights into the progress and growth of your LinkedIn profile. It features several key components:
Profile info
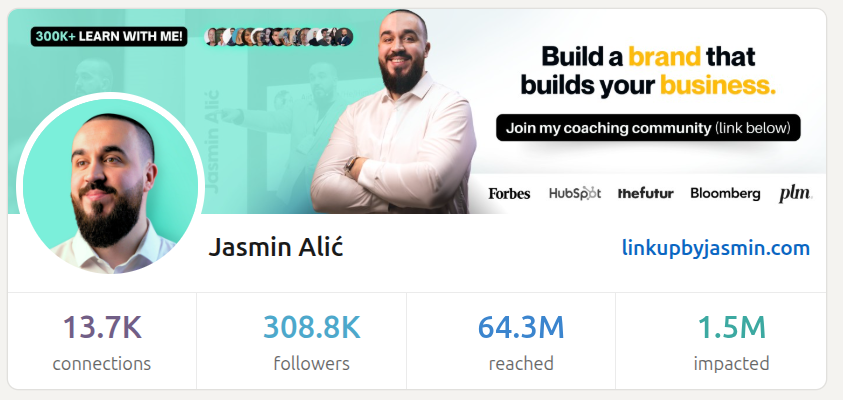
This card provides a real-time overview of your current number of connections and followers. Impacted represents the total number of people who engaged with your posts, meaning the total number of all reactions (comments are not counted).
Best time to post
You’ve seen generic advice like “post Tuesdays at 9 AM.” But what works for others might not work for you.
Every AuthoredUp user now has a personalized machine learning model that analyzes their post history and benchmarks it against similar profiles in their cohort.
The result: a chart that shows your best posting times, not those of a typical user.
For each day of the week, we also highlight:
- Landmark posts - which specific content performed the best
- Hotspots - the most effective time slots
Use it to time your content with more confidence, and better outcomes.
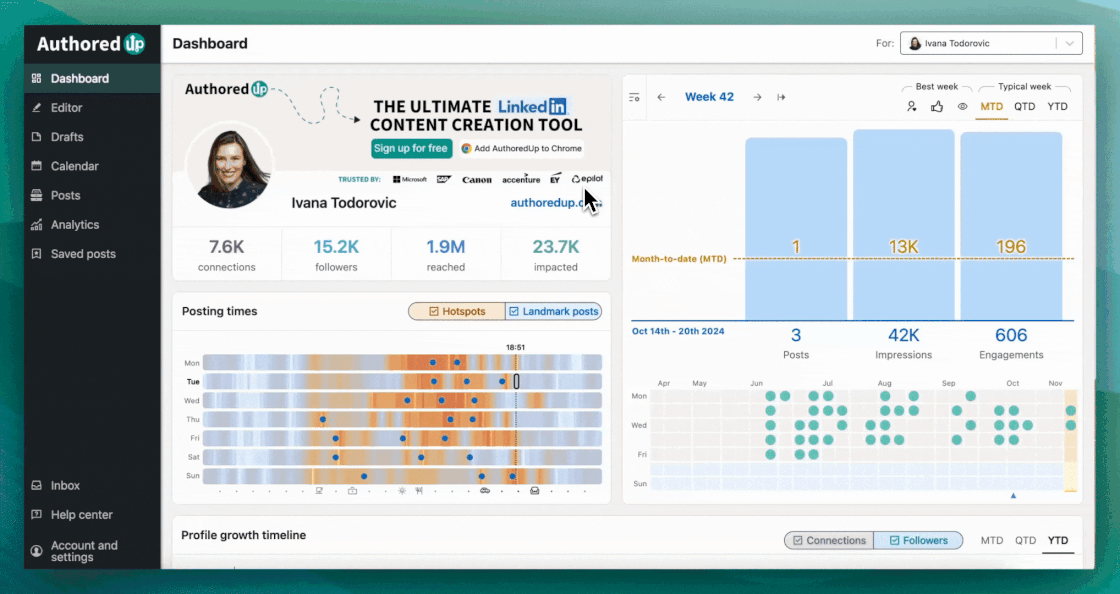
Weekly performance graph
The first card on the right answers the question: Am I getting better?
Our Weekly Performance Graph allows you to compare the current week’s performance with your typical week. You can define your typical week by displaying the average over the past month, quarter, or year.
For those aiming to push their limits, you can also compete with your best-performing week by selecting the one with the highest number of gained followers, most engagements, or most impressions.
The primary goal of this card is to motivate you to continuously improve and maintain consistency week after week.

You can reorder, add or remove weekly metrics you wish to track by clicking on the Settings button in the upper left corner.
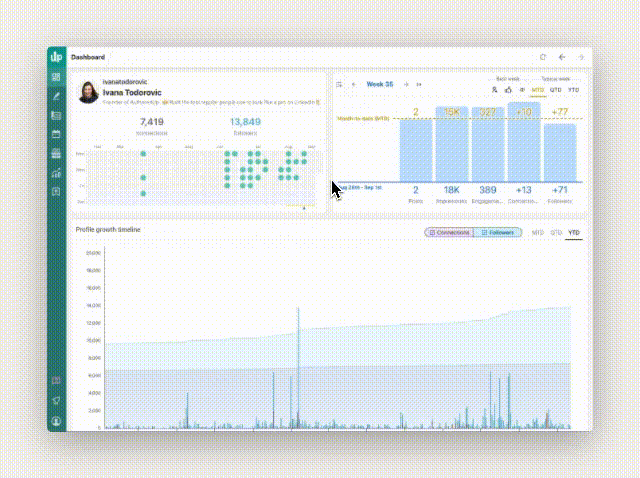
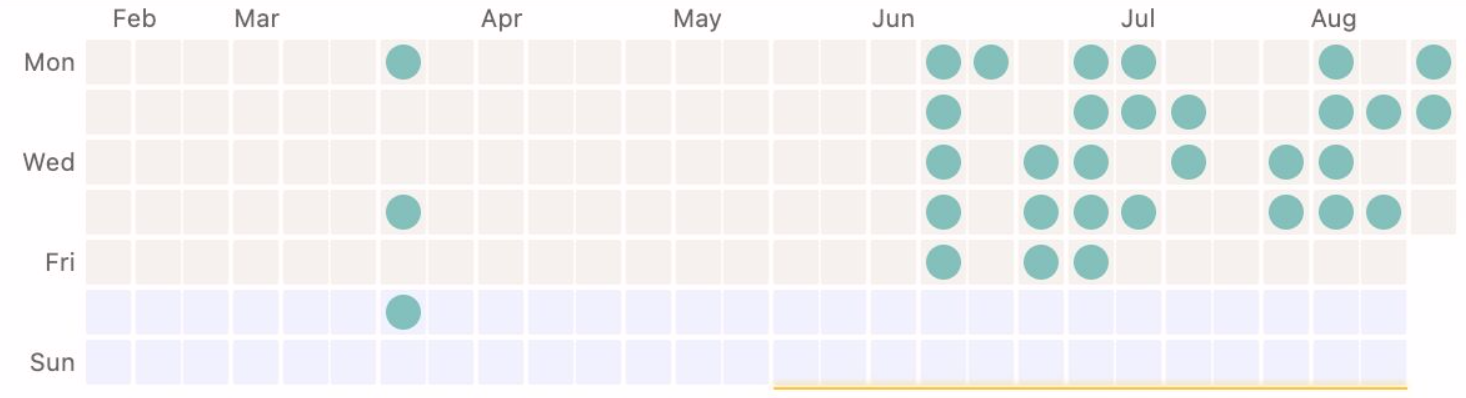
Activity chart
The second card on the right addresses the question: Am I consistent?
Like all social media platforms, LinkedIn rewards users who maintain an active presence by regularly posting content. Based on our data, consistency is defined as posting at least three times a week for six months. Meeting this criterion will result in LinkedIn extending the reach of your posts and showcasing them to a broader audience.
Does it mean you should never take a break? Not necessarily. However, once you return from a vacation, it’s important to re-engage with your feed. Our Activity Chart will guide you in the right direction.
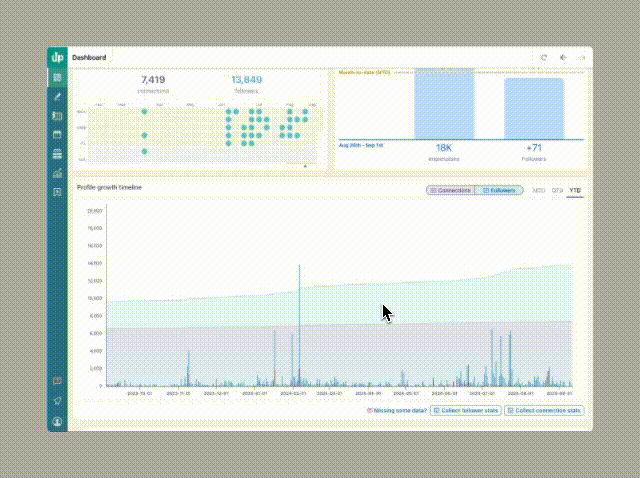
Profile growth timeline
The next section addresses the question: Is my profile growing?
Not only can you track the growth of your profile, but you can also identify which posts have contributed to that growth. This allows you to pinpoint what resonates most with your audience. Hint: it’s not always your most viral post.
Note: To display the data on this graph, you need to click the Collect follower/connection stats buttons in the bottom right corner.

In the top right corner, you have the option to switch between tracking your profile growth over the past month, quarter, or year. Additionally, you can choose to display either the number of connections, followers, or both.
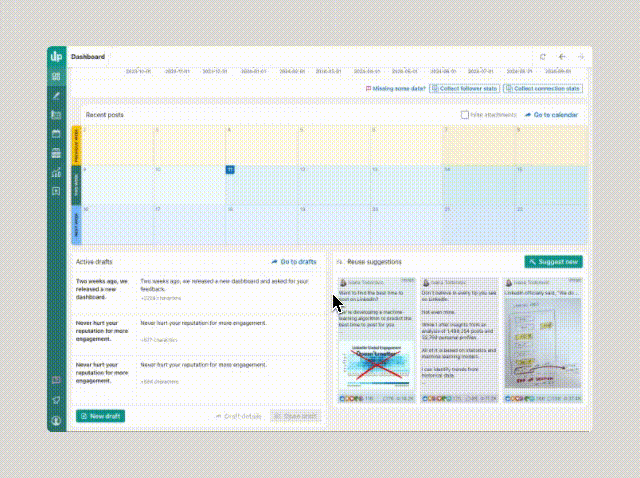
Recent posts
If you scroll down, you'll find a cross-section of the calendar that allows you to view your active and upcoming content, organized across the previous, current, and upcoming week. This section provides a quick overview of your content's performance.

Current drafts
Here, you can view the three most recently created drafts. With a single click, you can continue editing, schedule, or publish them. Additionally, there is a shortcut available for creating new drafts.

Reuse suggestions
This section allows you to discover the ideal posts to reuse. Each day, our machine learning algorithm will recommend three of your past posts for reuse, selected based on factors such as time range, posting frequency, engagement rate, and other key metrics.
Why develop new content, if you already have a great post that has resonated with your audience?

If you're not satisfied with the current selection of suggested posts, click the Suggest new button.
Please note that you can modify the weights to fit your workflow. To customize reuse suggestions click on the Settings button in the upper left corner and set the age range, impressions, interactions and/or random factor.
If needed, you can switch to the Company Dashboard to track the performance of your company pages — all from the same workspace.