Team Analytics gives you an overview of your team's LinkedIn performance in one place. You can analyze performance for all Actors, compare different Cohorts, and track how teams perform over time using key engagement metrics.
Note: This feature is only available to users who are subscribed to the Business plan.
Accessing Team Analytics
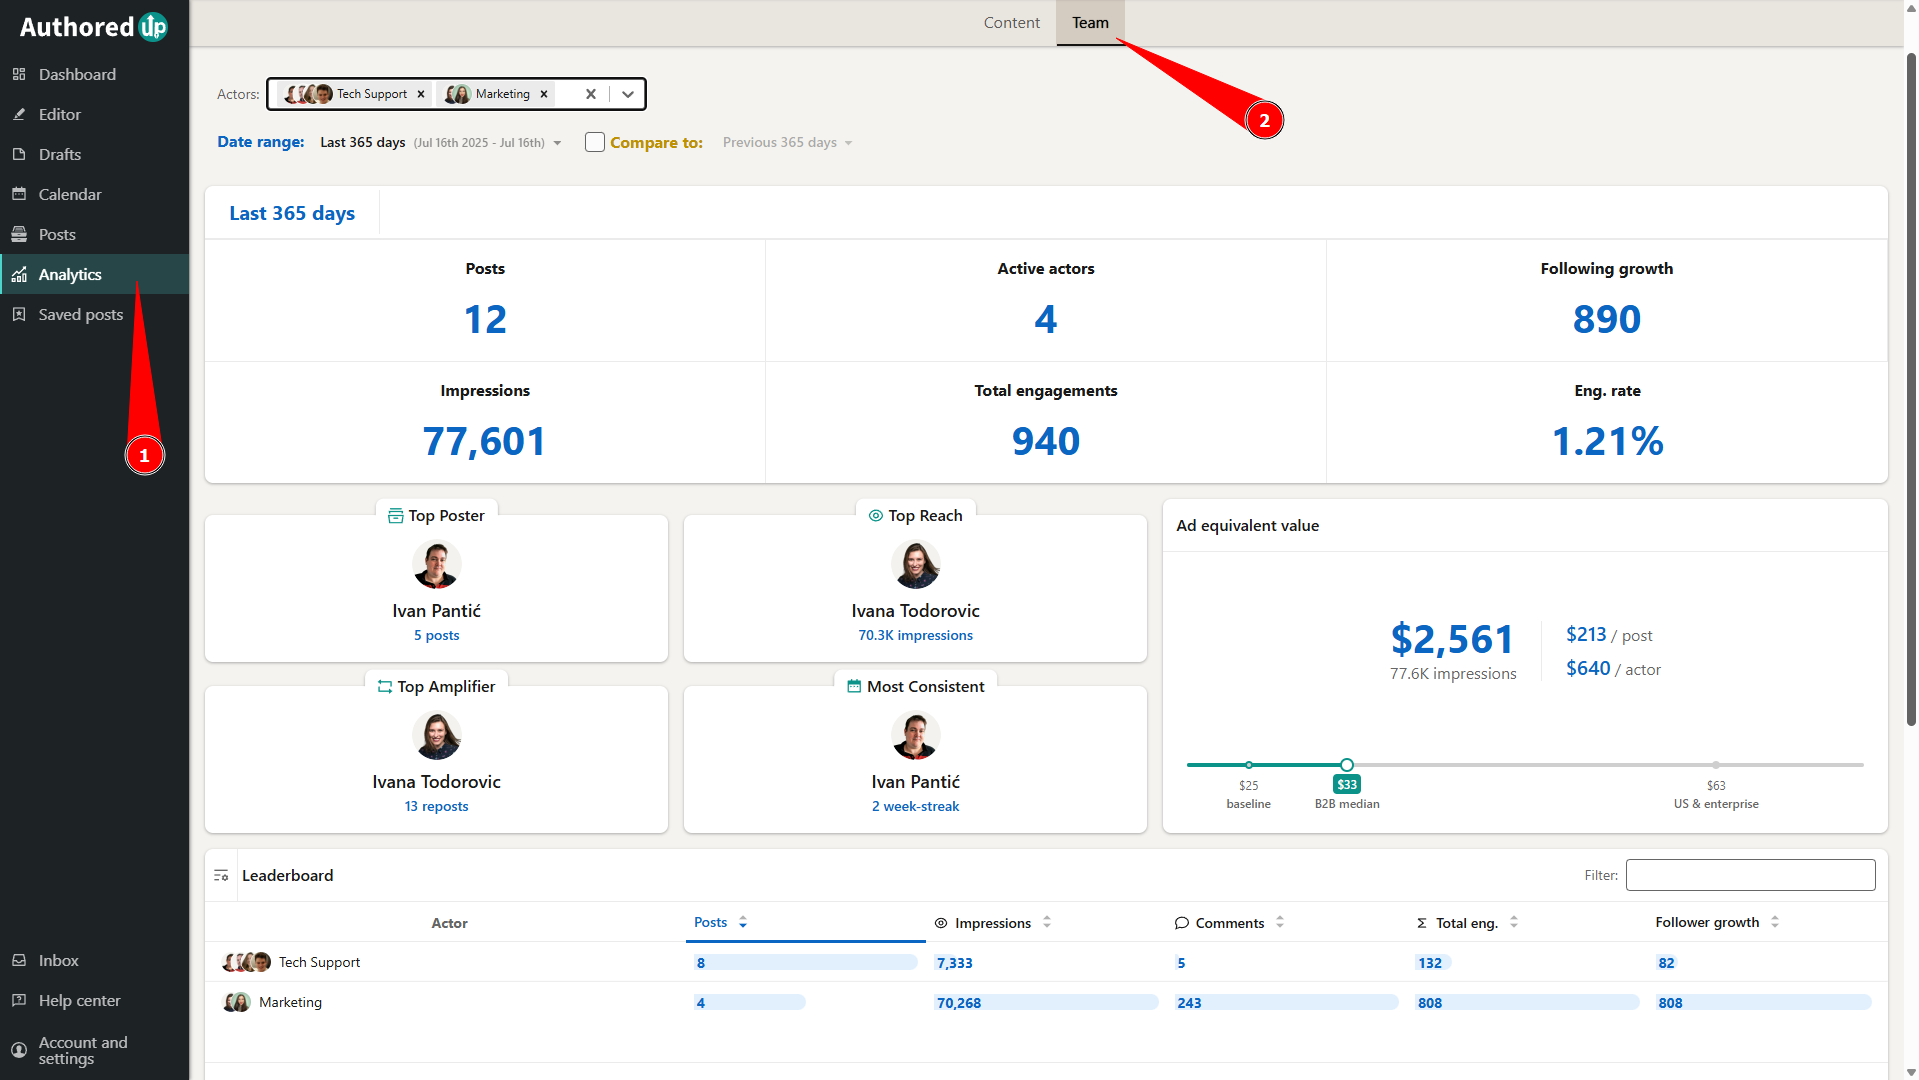
To access Team Analytics, click Analytics in the left-hand navigation menu, then select the Team tab at the top of the page.
Selecting Actors and Cohorts
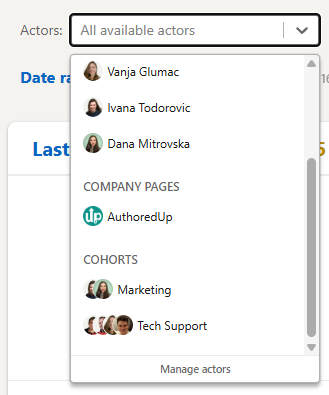
Use the Actors dropdown menu to choose which Actors or Cohorts you want to analyze.
You can select individual Actors, one or more Cohorts, or a combination of both to customize the data displayed throughout Team Analytics.
To learn how to create and manage Cohorts, see What are Cohorts and how do I use them?
Overview of Team Analytics
In the main Team Analytics section, you can see an overview of the selected actors or cohorts' performance during the chosen time period. The overview includes:
- The total number of posts published by the selected actors or cohorts.
- The number of actors who published at least one post during the selected period.
- The combined number of followers gained.
- Total impressions generated.
- Total engagement and engagement rate.
Comparing performance
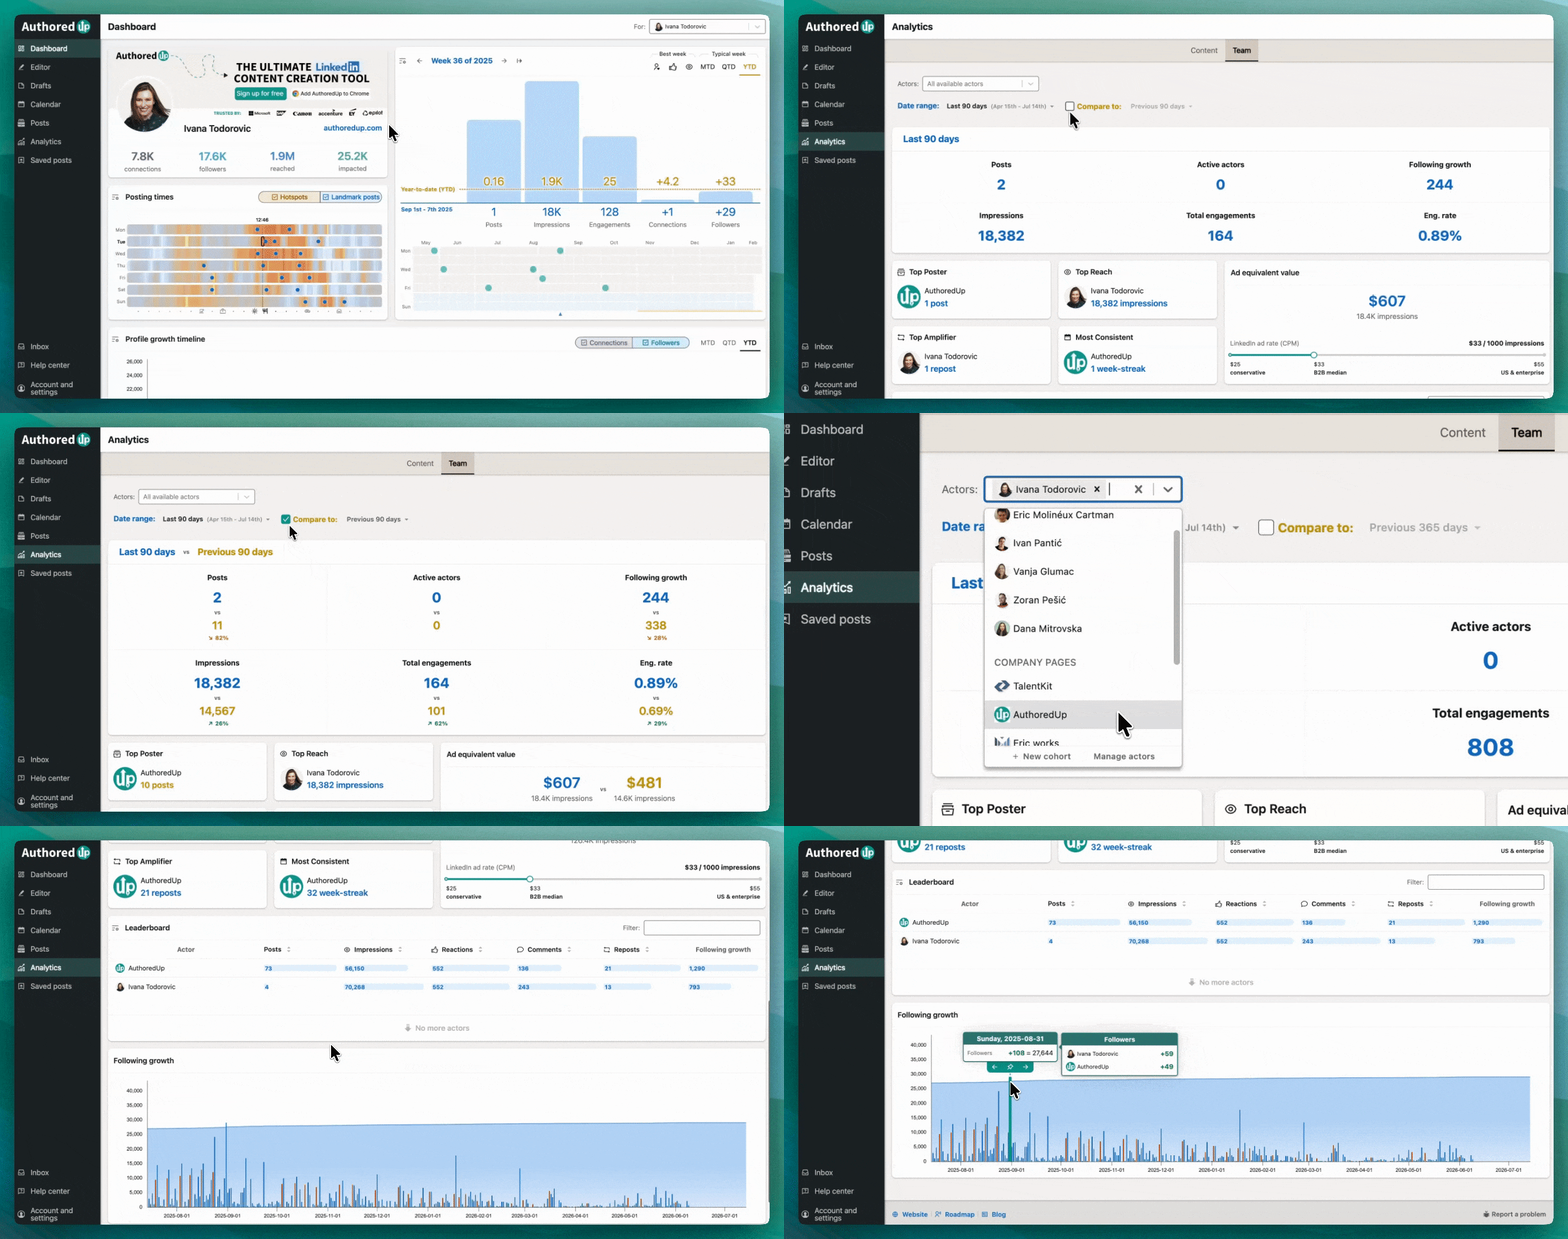
By default, Team Analytics displays performance for the selected Actors or Cohorts within the chosen Date range.
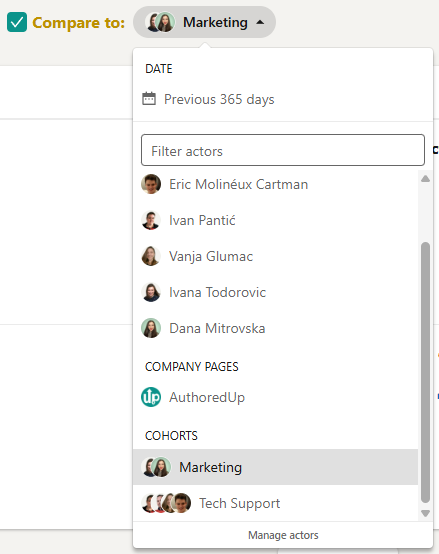
Enable the Compare to check box to compare the selected data with another time period, individual Actors (profiles and company pages), or Cohorts.

You can compare your data against:
- Previous period - compares the selected date range with the equivalent previous period.
- Actors - compares the selected Actors or Cohorts with one or more individual profiles or company pages.
- Cohorts - compares the selected Actors or Cohorts with another Cohort.
Performance Highlights
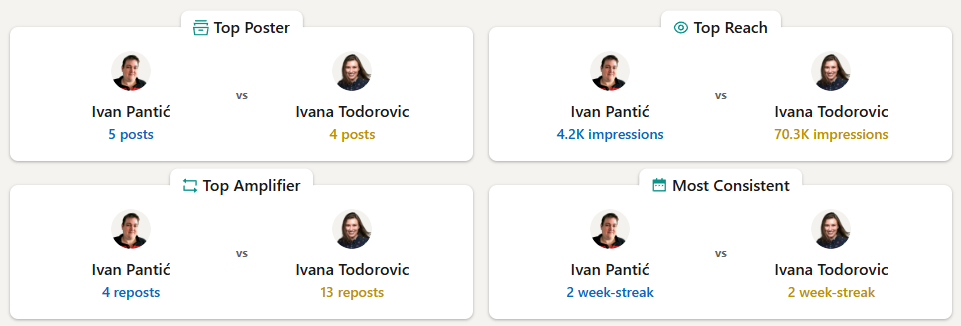
The Performance Highlights section highlights team members who stand out in different areas of content performance during the selected date range:
- Top Poster – The team member who has posted the most content during the selected date range.
- Top Reach – The team member whose posts have reached the most people during the selected date range.
- Top Amplifier – The team member whose posts have been shared the most during the selected date range.
- Most Consistent – The team member with the longest posting streak during the selected date range.
Ad Equivalent Value
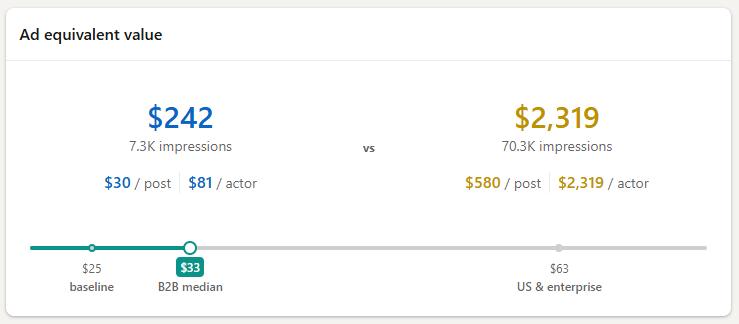
Ad Equivalent Value estimates how much it would cost to achieve the same number of impressions through LinkedIn ads instead of organic content.
It is calculated based on the number of impressions generated and the selected CPM (cost per 1,000 impressions):
Impressions × (CPM / 1,000)
The default CPM value is $33, based on the median CPM for B2B LinkedIn campaigns. You can adjust this value to match your own LinkedIn advertising costs.
Example:
If your team’s organic content generates 100,000 impressions and your CPM is set to $33, the Ad Equivalent Value would be:
100,000 ÷ 1,000 × $33 = $3,300
This means that achieving the same number of impressions through LinkedIn ads would have an estimated cost of $3,300.
Leaderboard
The Leaderboard provides a detailed breakdown of performance for the selected Actors or Cohorts during the chosen date range.
It includes the following metrics:
- Posts – The number of posts published during the selected period.
- Impressions – The total number of impressions generated by published posts.
- Comments – The total number of comments received on published posts.
- Total Engagement – The total number of reactions, comments, and reposts generated by published posts.
- Follower Growth – The total number of new followers gained during the selected period.

By default, the Leaderboard can display performance data for selected Actors or Cohorts. When working with cohorts, you can expand a Cohort to view individual Actors within it.
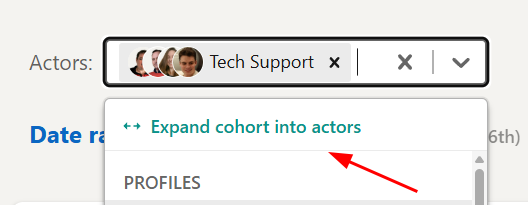
Expanding Cohorts provides a faster way to switch between a Cohort-level overview and individual Actor performance without changing your selection. You can easily switch back by clicking Collapse actors into cohort.

You can also use the filter option in the top-right corner of the Leaderboard to display only specific Actors or Cohorts. This is useful when you want to review the performance of specific team members or groups.

Follower Growth
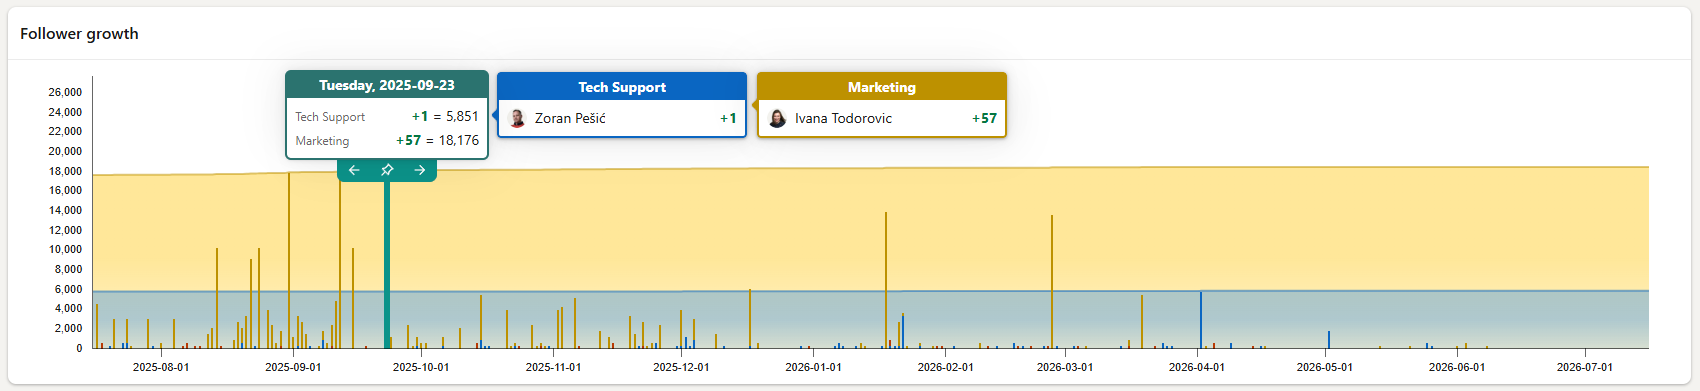
The Follower Growth chart shows how many new followers the selected Actors or Cohorts gained during the selected date range.
Each data point represents the follower growth for a specific day. By clicking on a data point, you can view a detailed breakdown of follower growth within a selected Cohort, including how many followers each team member gained on that day.
This makes it easier to identify individual contributions to overall Cohort growth and track follower growth trends over time.